Trade Show Industry Snags Highest Quarterly Growth in Eight Years
September 1, 2015

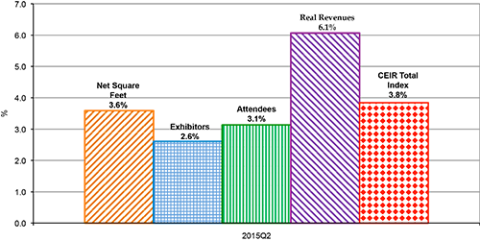
After a big increase in the first quarter of this year, the performance of the business-to-business trade show industry, as measured by the Center for Exhibition Industry Research’s Total Index, remained relatively strong during the second quarter of 2015, posting a year-on-year gain of 3.8 percent.

This growth is the second highest rate since the second quarter of 2007 and also marked the 20th consecutive quarter of year-on-year growth.

"The second-quarter results are very promising,” said CEIR Economist Allen Shaw, Ph.D., Chief Economist for Global Economic Consulting Associates.

He added, “They show that the exhibition industry is on a solid position for robust growth this year.”

All 14 sectors enjoyed year-on-year gains during the first half of 2015. So far in 2015, the leading sectors have been Building, Construction, Home & Repair (HM), which increased by a whopping 11.8 percent, and Industrial/Heavy Machinery and Finished Business Inputs (ID), which has jumped 10.9 percent.

Conversely, the weakest performing sectors are Raw Materials and Science (RM), gaining by only 0.9%, and Discretionary Consumer Services and Goods (CS), rising a moderate 1.9 percent.

Early this year, the outlooks for Education and Nonprofit (ED) and Government (GV) sectors were pessimistic as tight budgets and sluggish government employment were expected to shrink the potential attendee lists for those exhibitions.

The outlook was especially grim for exhibitions catering to government services, such as military applications.

However, according to the CEIR Index, ED and GV have grown unexpectedly by respectable amounts so far this year.

After several down years, the expansion in these areas may reflect some pent-up demand by state and local employees looking to retool their enterprises.

These stronger than expected gains in ED and GV provide a boost to the overall performance of the exhibition industry.

As an objective measure of the annual performance of the exhibition industry, the CEIR Index measures year-over-year changes in four key metrics to determine overall performance: Net Square Feet of Exhibit Space Sold; Professional Attendance; Number of Exhibiting Companies; and Gross Revenue.

The CEIR Index provides data on exhibition industry performance across 14 key industry sectors: Business Services; Consumer Goods; Discretionary Consumer Goods and Services; Education; Food; Financial, Legal and Real Estate; Government; Building, Construction, Home and Repair; Industrial/Heavy Machinery and Finished Business Outputs; Communications and Information Technology; Medical and Health Care; Raw Materials and Science; Sporting Goods, Travel and Entertainment; and Transportation. 

Click here for information on how to purchase the complete CEIR Index Report, which analyzes the 2014 exhibition industry and provides a future outlook for the next three years.

Predict: CEIR's Annual Outlook Conference will be held Sept. 16-17 at the JW Marriott in Chicago, where an expert economist will provide an outlook on the global economy and how the exhibition industry is faring nine months into the year.

Visit www.ceir.org/predict for more details.
Add new comment

Partner Voices
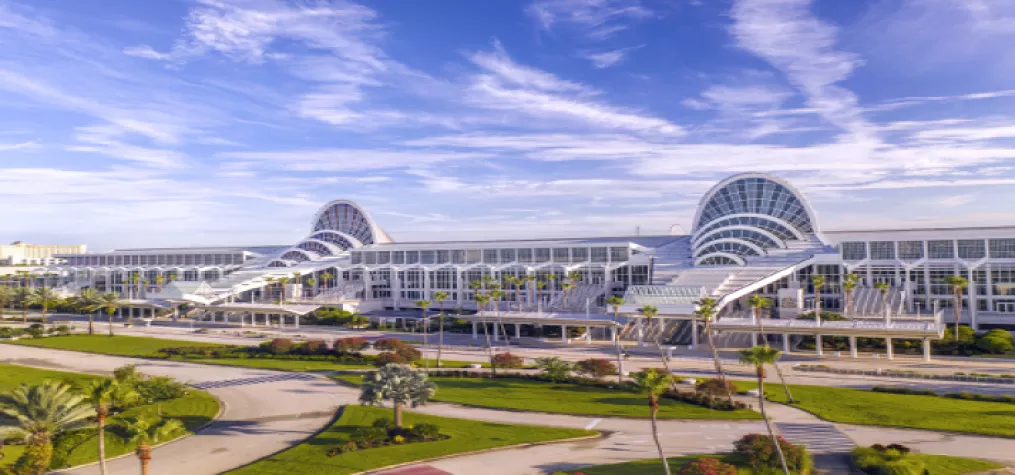
Overview: The award-winning Orange County Convention Center (OCCC) goes the extra mile to make every day extraordinary by offering customer service excellence and industry-leading partnerships. From their dedicated in-house Rigging team to their robust Exhibitor Services, The Center of Hospitality brings your imagination to life by helping you host unforgettable meetings and events. With more than 2 million square feet of exhibit space, world-class services and a dream destination, we are committed to making even the most ambitious conventions a reality. In October 2023, the Orange County Board of County Commissioners voted to approve allocating Tourist Development Tax funding for the $560 million Phase 5A completion of the OCCC. The Convention Way Grand Concourse project will include enhancements to the North-South Building, featuring an additional 60,000 square feet of meeting space, an 80,000- square-foot ballroom and new entry to the North-South Building along Convention Way. “We are thrilled to begin work on completing our North-South Building which will allow us to meet the growing needs of our clients,” said OCCC Executive Director Mark Tester. “As an economic driver for the community, this project will provide the Center with connectivity and meeting space to host more events and continue to infuse the local economy with new money and expanding business opportunities.” Amenities: The Center of Hospitality goes above and beyond by offering world-class customer service and industry-leading partnerships. From the largest convention center Wi-Fi network to custom LAN/WAN design, the Center takes pride in enhancing exhibitor and customer experience.  The OCCC is the exclusive provider of electricity (24-hour power at no additional cost), aerial rigging and lighting, water, natural gas and propane, compressed air, and cable TV services. Convenience The Center is at the epicenter of the destination, with an abundance of hotels, restaurants, and attractions within walking distance. Pedestrian bridges connect both buildings to more than 5,200 rooms and is within a 15-minute drive from the Orlando International Airport. The convenience of the location goes hand-in-hand with top notch service to help meet an event’s every need. Gold Key Members The OCCC’s Gold Key Members represent the best of the best when it comes to exceptional service and exclusive benefits for clients, exhibitors and guests. The Center’s Gold Key memberships with Universal Orlando Resort, SeaWorld Orlando and Walt Disney World greatly enhance meeting planner and attendee experiences offering world-renowned venues, immersive experiences and creative resources for their events. OCCC Events: This fiscal year, the OCCC is projected to host 168 events, 1.7 million attendees, and $2.9 billion in economic impact.  The Center’s top five events during their 2022-2023 fiscal year included:  AAU Jr. National Volleyball Championships 2023 200,000 Attendees $257 Million in Economic Impact MEGACON 2023 160,000 Attendees $205 Million in Economic Impact Open Championship Series 2023 69,500 Attendees $89 Million in Economic Impact Sunshine Classic 2023 42,000 Attendees $54 Million in Economic Impact Premiere Orlando 2023 42,000 Attendees $108 Million in Economic Impact